
•7 months
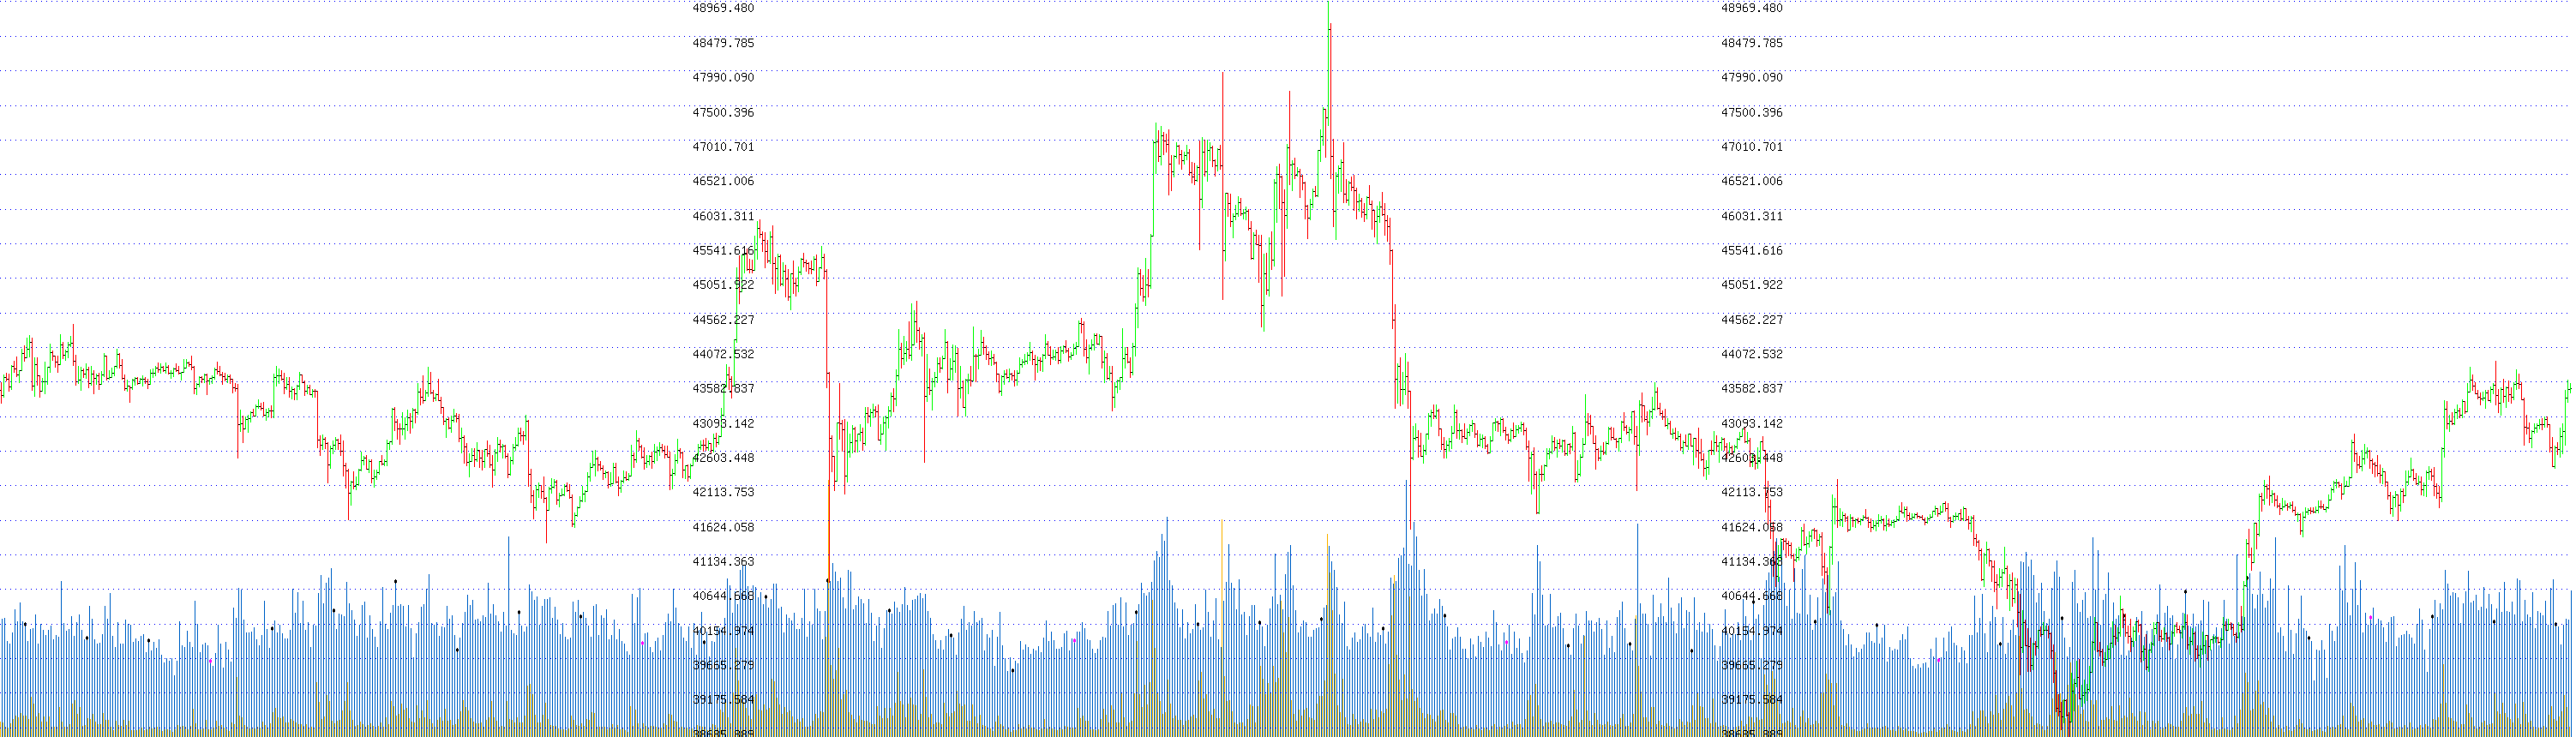
Last 1000 hours of BTC.
Both enthusiasts (last week) and skeptics (previous two weeks) will find something here for themselves. In addition to the price chart, at the bottom there is the volume of transactions (blue) and the average transaction value (orange). Black dots indicate 12:00 and pink dots indicate 12:00 on Sundays.
Both enthusiasts (last week) and skeptics (previous two weeks) will find something here for themselves. In addition to the price chart, at the bottom there is the volume of transactions (blue) and the average transaction value (orange). Black dots indicate 12:00 and pink dots indicate 12:00 on Sundays.
Show original content

0 users upvote it!
0 answers